4. How segmentation works
This chapter explains what a click actually means. It is short, and it is the most useful chapter in the manual. Everything in chapters 5 through 9 assumes it.
4.1 AND, OR, NOT
Three rules govern every canvas:
Rule 1 — Values of different criteria are combined with AND.
Industry = Technology and Country = US on the same canvas produce an overlap that
means Technology and US. Adding criteria narrows.
Rule 2 — Values of the same criterion are combined with OR.
Industry = Technology and Industry = Manufacturing mean Technology or
Manufacturing. A record cannot be in two industries at once, so their overlap is
always empty — 4Segments knows this and does not waste a query on it.
Rule 3 — Anything you did not select is excluded. This is the one people miss. Clicking the centre of a three-circle Venn does not just mean "in all three" — it means in all three and not anywhere else, which for a Venn centre is the same thing. But clicking one circle's outer crescent means in this circle and not in either of the other two. That is a NOT, and it is why the numbers in the legend do not add up the way you might first expect.
4.2 Exclusive and inclusive counts
Look carefully at a Venn canvas and you will see two different kinds of number.
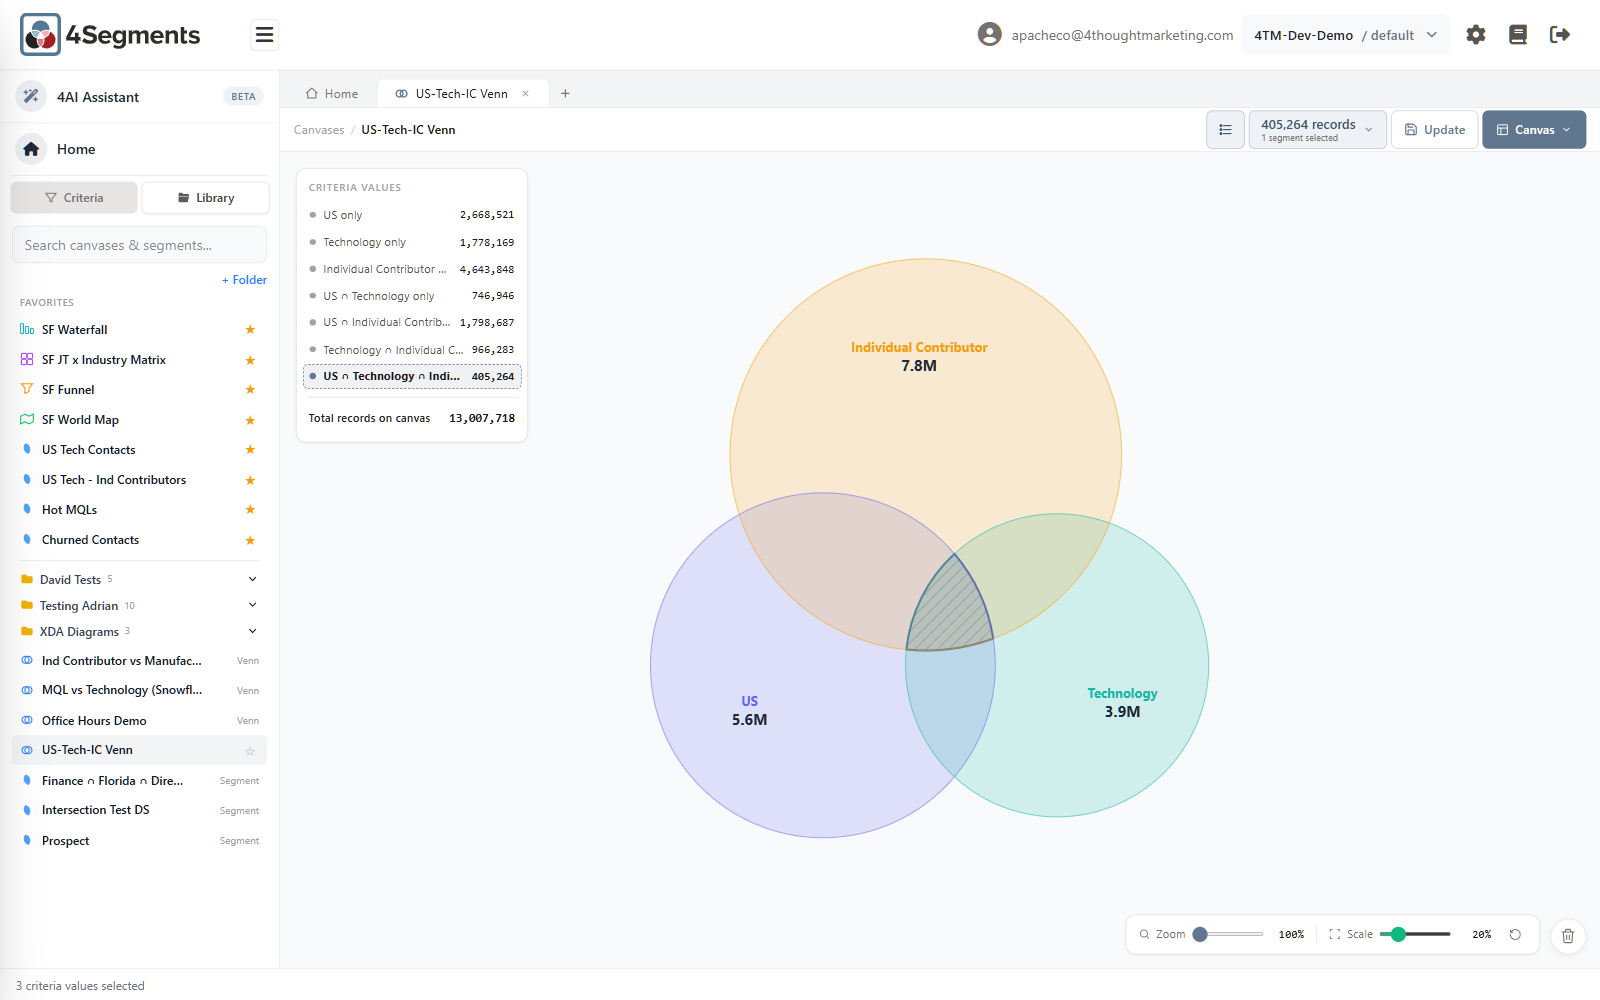
Inside each circle is that circle's inclusive total — every record in it, overlaps included. Technology 3.9M means 3.9 million records are Technology, regardless of what else they are.
In the legend panel are exclusive counts — each region counted once, with no double-counting:
| Legend row | Means |
|---|---|
US only — 2,668,521 |
US, but not Technology and not Individual Contributor |
US ∩ Technology only — 746,946 |
Both of those, but not Individual Contributor |
US ∩ Technology ∩ Individual Contributor — 405,264 |
All three |
| Total records on canvas — 13,007,718 | The union of all three circles |
Because the legend rows are exclusive, they sum exactly to the total. The in-circle numbers do not, and are not meant to.
Both numbers are correct. They answer different questions.
4.3 Selecting
Click a region to select it. Click it again to deselect. Click more regions to add them — there is no modifier key; multi-select is just more clicking.
Selected regions are shown with a diagonal hatch and a heavier outline.
Multiple selected regions are combined with OR. So selecting the centre and one lens gives you "in all three, or in these two" — a perfectly reasonable audience, and one that would be tedious to write by hand.
On a Venn canvas the legend rows are also buttons — clicking US ∩ Technology only
in the panel selects that region on the diagram. For small overlaps this is far easier
than aiming at the shape.
There is no "clear selection" button. Selections clear themselves when they stop making sense — when you add or remove a circle, merge two circles, or add a filter.
4.4 Selection gates everything
This is a deliberate product rule and it explains several "why is that greyed out?" moments:
Until you select something, you cannot export, save a segment, open the Records list, or drag anything off the canvas. The Segment button reads just Segment and is disabled; the records-list button is disabled.
Hovering a region shows you its number in a tooltip. That is browsing. Clicking it is committing.
4.5 Going past three circles
A Venn diagram can hold three circles. That is arithmetic, not a limitation of the software: with four proportional circles you cannot draw all fifteen overlaps, so something has to be sacrificed — either the shapes stop being circles or the areas stop being proportional.
4Segments solves it differently. Drag your selection to a new canvas.
Worked example — you want Technology and Individual Contributor and US and Lead Score 75–100, which is four conditions:
- On canvas 1, put Technology, Individual Contributor and US on a Venn.
- Click the centre. The count box reads 405,264.
- Drag that selection onto the + tab (or use Segment ▾ → Open in new canvas).
- Name it — "US Tech ICs" — and choose Venn diagram.
- Canvas 2 opens with one circle containing exactly those 405,264 records.
- Drag
Lead Score 75 – 100onto canvas 2 and click the overlap.
You now have a four-condition segment, and you have two more circles free on canvas 2. Repeat as often as you like. There is no ceiling.
The named segment is saved to your Library on the way, so the intermediate step is reusable rather than throwaway.
4.6 Merging circles
Sometimes you want two circles to become one rather than overlap. Los Angeles and San Diego, treated together as "Southern California".
Drag one circle's name label onto another circle. A dialog appears:
Merge circles Combine "Los Angeles" and "San Diego" into a single circle (records in either)? Name:
Los Angeles and San DiegoCancel · Merge
The result is a union — records in either. It frees up a circle slot, so a merge lets you fit more criteria on one canvas.
Two things to know:
- You must grab the name label. Dragging from elsewhere in the circle pans the view instead.
- A merge is not a saved segment. It lives on this canvas, is stored with the canvas when you save, and disappears if you delete the merged circle. Its members are not restored when you delete it.
4.7 Removing a circle
Drag the circle's name label to the trash can at the bottom-right of the canvas. It turns red when you are over it. Confirm:
Remove Circle — Remove "Technology" from this Venn diagram?
There is no undo, and no recycle bin, anywhere in 4Segments. Re-drag the criteria value to bring the circle back.
4.8 Where the numbers come from
Worth knowing so you can judge how much to trust a number:
- Counts are produced by running
COUNTqueries against your datasource, one per region combination. - Results are cached in memory for the session, so revisiting a tab is instant. Changing the canvas re-queries.
- A saved canvas stores its definition, never its numbers. Reopening a canvas recalculates from live data. A canvas you saved in June, opened in September, shows September's counts.
- Counts shown in the sidebar are different: those come from the nightly refresh, not a live query. See Chapter 11.
One case is approximate, and 4Segments tells you: on a Matrix, selecting more than
one cell may double-count, because two values of the same criterion are not guaranteed
to be mutually exclusive. In that situation the count appears dimmed with a ~ prefix
(~35,410 records) until a de-duplicated server count replaces it a moment later. The
provisional number is never used for an export.
Next: 5. Canvas types →